
We will learn the easiest way to debug the ribbon buttons in Dynamics 365. Before we start, make sure to subscribe to CRM Crate so that you stay up-to-date in field of Dynamics 365.
What are ribbon buttons in Dynamics 365?
Dynamics 365 CE displays the commands in different formats depending on the entity and the client. In most places in the web application you will see a command bar instead of a ribbon. Dynamics 365 for tablets also uses data defined as ribbons to control what commands are available using a command bar that is optimized for touch.
Both the command bar and the ribbon use the same underlying XML data to define what commands to display, when the commands are enabled, and what the commands do.
Why do we need to debug the ribbon?
Considering your application is hosting entity ribbons with multiple custom functionalities such as execution of web URLs and JavaScript functions on ribbon button click. From a developer’s point of view, we need to continuously debug the properties of ribbon button configurations. The old legacy way of achieving this requirement is by using the “Ribbon Work Bench“. But now, we can directly debug the ribbon properties using an URL extension as shown below.
Debugging form’s ribbon using Command Checker –
Command Checker is a developer feature to debug the form’s ribbon bar and its properties. Follow the below steps to debug the ribbon using Command Checker.
Step 1 – Navigate to Dynamics 365 and open the entity record for which you need to debug the ribbon.
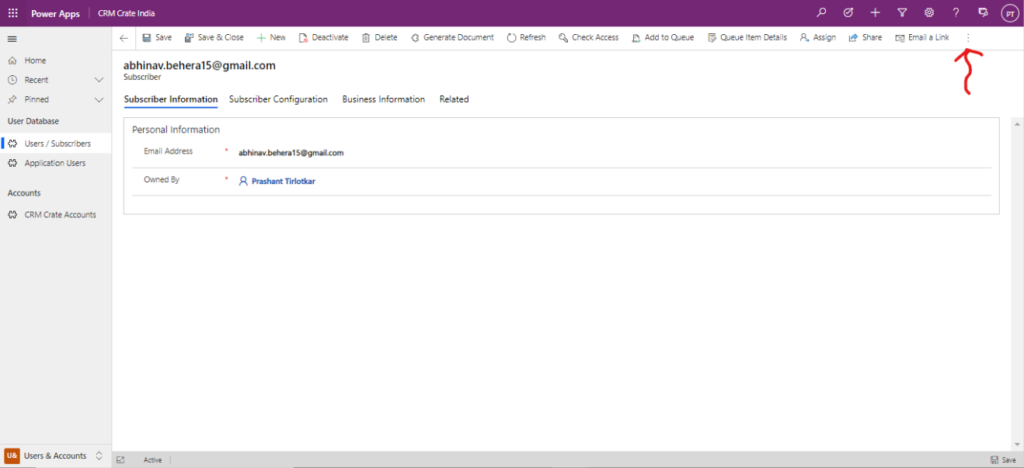
Step 2 – Click on the more button (…) and verify if you can see the button called “Command Checker”. If you are not able to view the Command Checker button then follow the below given Step 3 and Step 4.
Step 3– Copy the record URL and modify the URL by adding the URL extension “&ribbondebug=true“.
Consider the below example: –
| Original Record URL | Modified Record URL (Command Checker) |
| https://crmcrateindia.crm8.dynamics.com/main.aspx?appid=f4390255-0c86-eb11-a812-6045bd726f3b&pagetype=entityrecord&etn=cc_subscriber&id=4750ab39-4286-eb11-b1ad-000d3a3e1464 | https://crmcrateindia.crm8.dynamics.com/main.aspx?appid=f4390255-0c86-eb11-a812-6045bd726f3b&pagetype=entityrecord&etn=cc_subscriber&id=4750ab39-4286-eb11-b1ad-000d3a3e1464&ribbondebug=true |
Step 4 – Enter the modified URL in the web browser and navigate to the more button (…) and verify if you can see the button called “Command Checker”. You can view the ribbon properties and configurations data on clicking the button “Command Checker” as shown below.
Thus we learned an easiest way to debug the ribbon buttons in Dynamics 365.