
We will learn, understand & master Debugging and Troubleshooting of Canvas Apps with help of Monitor feature. Before we start, make sure to subscribe to CRM Crate so that you can stay up to date in the field of Power Platform.

Canvas apps have revolutionized the way we interact with data and build user interfaces. However, with great power comes the need for effective debugging and troubleshooting. In this blog post, we will explore the essential techniques and tools to unravel the mysteries of Canvas App development, equipping you with the skills to identify and resolve issues seamlessly.
Debug a Canvas App using Monitor
The Monitor feature is inherently included in all canvas apps. It enables you to track events in real-time within a canvas app while in the Power Apps Studio authoring environment. Additionally, Monitor can be utilized for debugging the published version of a canvas app. Follow the below steps for troubleshooting your Canvas App with Monitoring feature.
Step 1: Create a new Canvas App or use an existing Canvas App in Power App Maker Portal (https://make.powerapps.com).
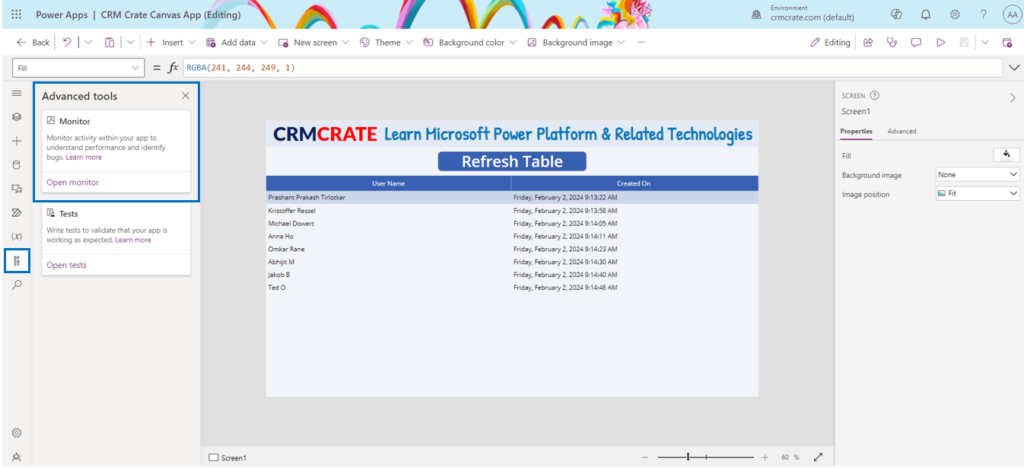
Step 2: In the Maker Portal, navigate to the left hand panel and select Advance Tools. Open “Monitor” as shown below.
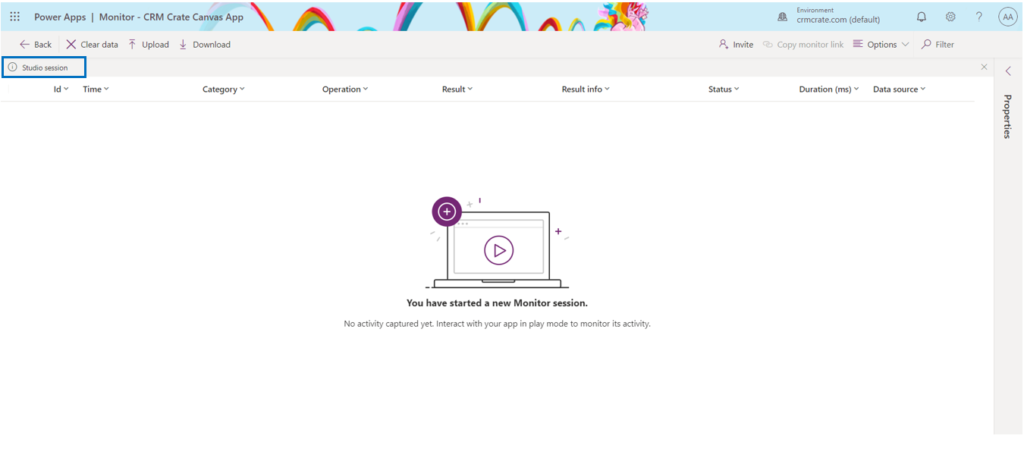
Step 3: Executing this action launches Monitor in a fresh browser tab, establishing a connection with your ongoing Power Apps Studio session. Further, a notification appears at the top to show the current monitoring session as a “Studio session”.
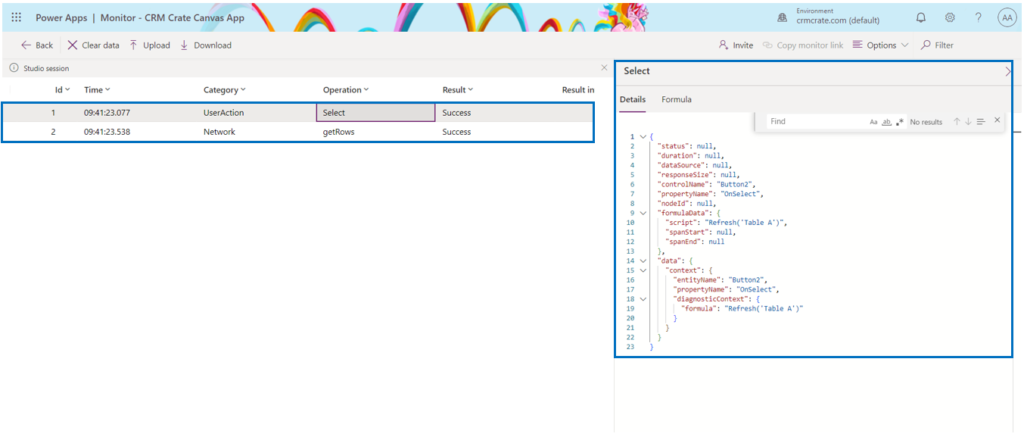
Step 4: Play your published Canvas App and return back to the Monitor window to observe & track different user / system events happening in Canvas App. In our demo, the application user has clicked on a button which is suppose to refresh a Data Source.
| Event Source | Event Action |
| User clicks on a button | Select action is used by Power App to invoke this operation |
| Power FX within a button refreshes a Data Source | GetRows action used by Power App to invoke this operation |
The below animation shows the debugging of our Canvas App using Monitor.
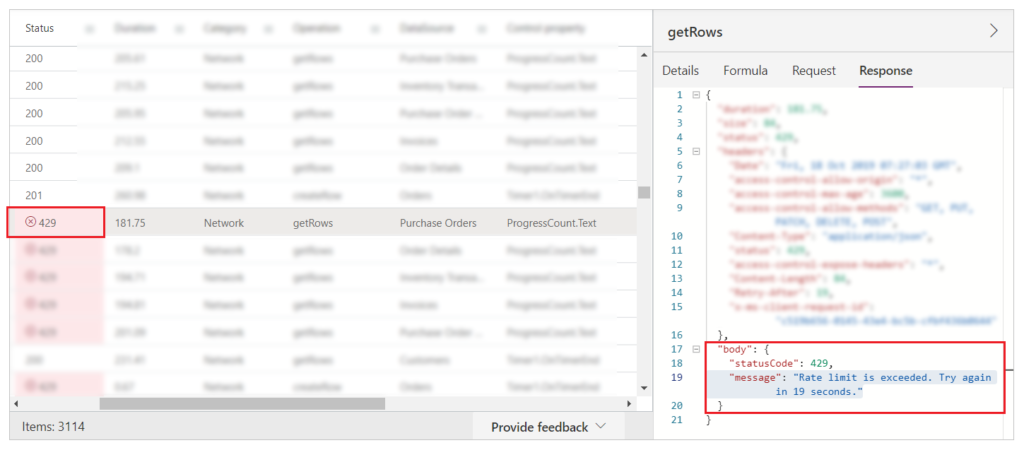
Further, you can also view more detailed debugging information in the monitoring window such as Power FX formula executed during the debugging instance, raw JSON input / output etc.
Now, consider an alternative situation where an application has been deployed, and the initial version encounters a decline in performance. The app sporadically produces errors without a discernible pattern. While data loading in the app is generally successful, occasional failures occur. Upon inspecting Monitor, you observe data operations proceeding as anticipated. Nevertheless, you also notice multiple responses with an HTTP status code of 429, signifying an excess of requests within a designated timeframe. Upon selecting such an event, the displayed error reads as “Rate limit exceeded. Please retry in XX seconds.” This is where you can find out the exact issue causing performance issue in your Canvas App.
In conclusion, harnessing the power of the Monitor feature in debugging Canvas Apps proves to be an indispensable skill for developers. The comprehensive insights provided by Monitor not only streamline the troubleshooting process but also empower developers to identify and rectify issues with precision.